Getting Started with PSI
This page describes Pressure Stall Information (PSI), how to use it, tools and components that work with PSI, and some case studies showing how PSI is used in production today for resource control in large data centers.
Overview
PSI provides for the first time a canonical way to see resource pressure increases as they develop, with new pressure metrics for three major resources—memory, CPU, and IO.
These pressure metrics, in conjunction with cgroup2 and other kernel and userspace tools described below, allow you to detect resource shortages while they’re developing, and respond intelligently—by pausing or killing non-essentials, reallocating memory in the system, load shedding, or other actions.
PSI stats are like barometers that provide fair warning of impending resource shortages, enabling you to take more proactive, granular, and nuanced steps when resources start becoming scarce.
See the PSI git repo for additional information.
Prerequisites
PSI is included in Linux kernel versions 4.20 and up. If building your own kernel, make sure CONFIG_PSI=y is set in the build configuration.
Your distribution might build the kernel with PSI support but disable the feature per default (CONFIG_PSI_DEFAULT_DISABLED), in which case you need to pass psi=1 on the kernel command line during boot.
Pressure metric interface
Pressure information for each resource is exported through the
respective file in /proc/pressure/—cpu, memory, and io.
You query the pressure stats by running the following command, inserting the name of the desired resource (memory, cpu, or io):
$ cat /proc/pressure/resource_name
The output format for CPU is:
some avg10=0.00 avg60=0.00 avg300=0.00 total=0
and for memory and IO:
some avg10=0.00 avg60=0.00 avg300=0.00 total=0
full avg10=0.00 avg60=0.00 avg300=0.00 total=0
Memory and IO show two metrics: some and full (defined below). The CPU controller shows only the some metric. The values for both some and full are shown in running averages over the last 10 seconds, 1 minute, and 5 minutes, respectively. The total statistic is the accumulated microseconds.
cgroup2 interface
In a system with a CONFIG_CGROUP=y kernel and the cgroup2 filesystem
mounted, pressure stall information is also tracked for tasks grouped
into cgroups. The subdirectory for each cgroup controller in the cgroupfs mountpoint contains
cpu.pressure, memory.pressure, and io.pressure files.
You query PSI for a cgroup by running the following command. This example queries io.pressure for a cgroup called cg1:
$ cat /sys/fs/cgroup/cg1/io.pressure
The output formats are the same as for the /proc/pressure/ files.
Pressure metric definitions
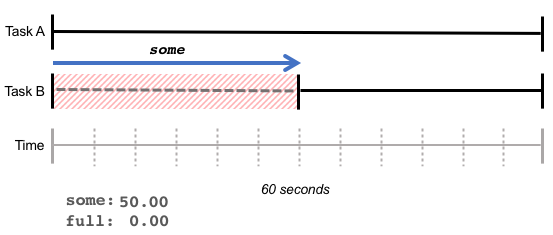
The some statistic gives the percentage of time some (one or more) tasks were delayed due to lack of resources—for example, a lack of memory. In the diagram below, Task A ran without delay, while Task B had to wait 30 seconds for memory, resulting in a some value of 50%.

some is indicative of added latency due to lack of resources: While the total amount of work done by the CPU may have remained the same, some tasks took longer.
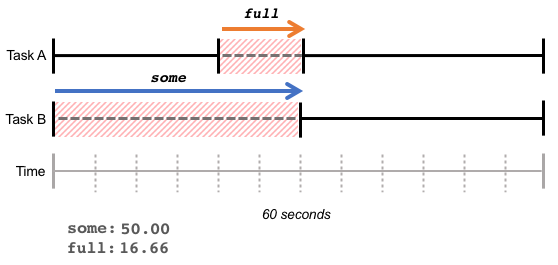
The full metric indicates the percentage of time in which all tasks were delayed by lack of resources, i.e., the amount of completely unproductive time. In the example below, Task B waited 30 seconds for memory; during 10 of those seconds, Task A also waited. This results in a full value of 16.66% and a some value of 50%.

A high full number indicates a loss of overall throughput – the total amount of work done decreases due to lack of resources.
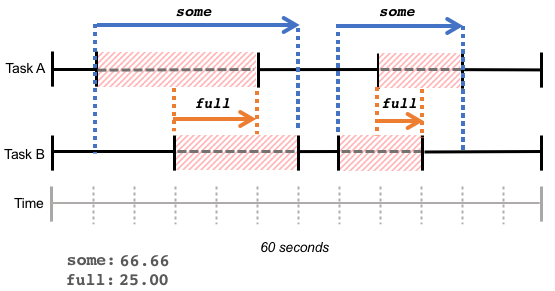
Note that the stats reflect the cumulative times tasks waited across the time span, whether the wait times were contiguous (as in the examples above), or a series of discrete wait times over the same time span:

The pressure metrics are cheap to read, and can be sampled for recent delays, or before and after certain task operations to determine their resource-related latencies.
PSI case studies
The following case studies provide details on the specific ways PSI metrics are being used in production today to drive resource control gains in large data centers:
- cgroup2 case studies: The case studies in the cgroup2 documentation describe how PSI metrics work with cgroup2 and related tools to maximize resource utilization in very large server farms.
- oomd: oomd is a new userspace tool that uses PSI thresholds as triggers to carry out specified OOM (out of memory) actions when memory pressure increases. See the case study of oomd's use at Facebook to see how PSI and oomd work together to prevent out of control OOM conditions, and drive significant capacity gains.
