Configuring and Running Benchmarks
Before running resctl demo, you need to run benchmarks for configuring some resctl-demo components. Setting up benchmarks can take longer than ten minutes to generate, so give enough time to run benchmarks before interacting with the demo. Keep the system idle while the benchmarks are in progress.
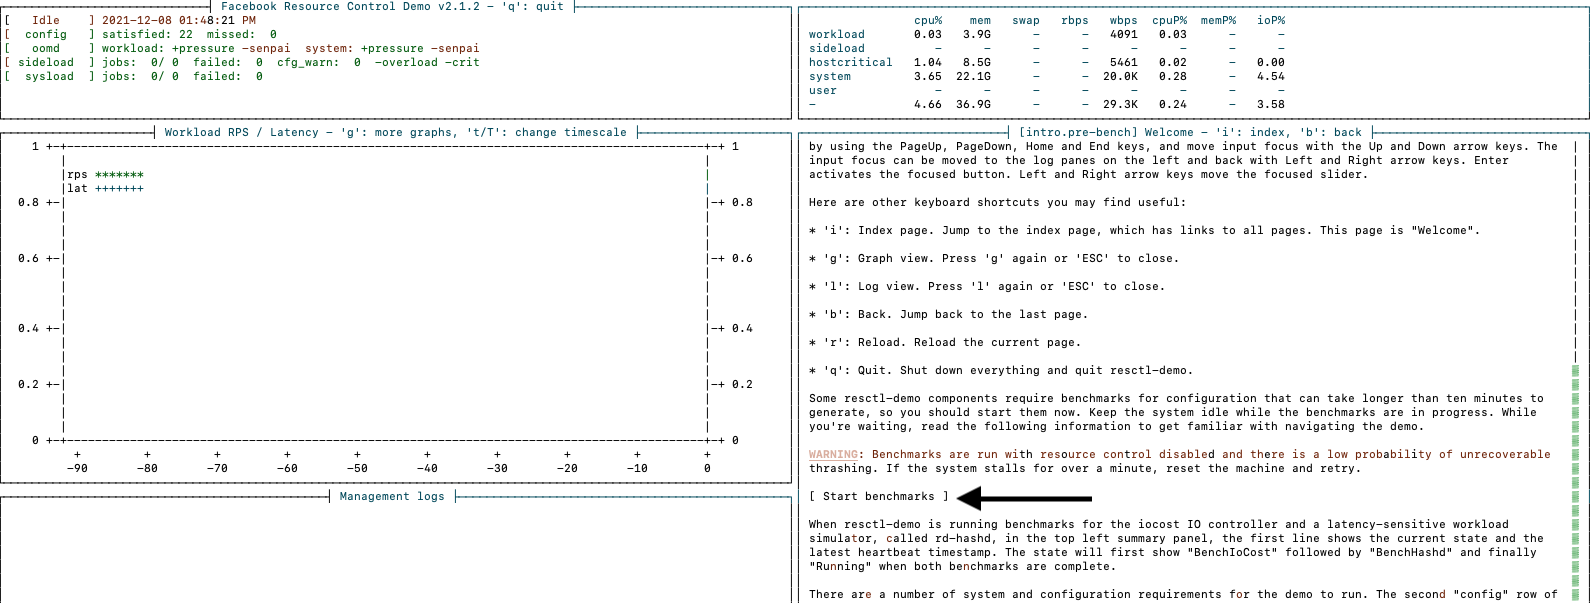
Go to the welcome page in the demo and click the Start benchmarks button to get the benchmark up and running.
note
If you already ran the benchmarks or are running the official AWS image on the c5d.4xlarge or c5d.9xlarge machine type. Benchmark results are already available, and clicking the Start benchmarks button won't do anything. If you want to rerun the benchmarks, visit the iocost and hashd sub-pages.
Warning
Demo runs benchmarks with resource control disabled, and there is a low probability of unrecoverable thrashing. If the system stalls for over a minute, reset the machine and retry.
The benchmarks try to calibrate resctl-demo so that the demo scenarios behave as expected. However, resctl-demo is primarily verified on the following setups:
- AMD Ryzen 7 3800X 8-Core 16-Threads CPU, 32G memory, Samsung 860 512G SSD
- AWS c5d.4xlarge - 16 vCPUs, 32G memory, local 450G SSD
- AWS c5d.9xlarge - 36 vCPUs, 72G memory, local 900G SSD
The demo scenarios may not behave as expected on setups that are significantly weaker than #1, especially on SSDs with high and inconsistent latency profiles. When requests per second (RPS) suddenly dips or stays low, open the graph view with 'g' and check out the IO utilization and read latency graphs.
Read latencies on some SSDs occasionally spike up to tens of milliseconds even when the host isn't issuing an overwhelming amount of IOs. Unfortunately, there is only so much the kernel can do for latency sensitive workloads when a single IO takes tens of milliseconds.
When resctl-demo runs benchmarks for the iocost IO controller and a
latency-sensitive workload simulator, called rd-hashd, the first line in the top left
summary panel shows the current state and the latest
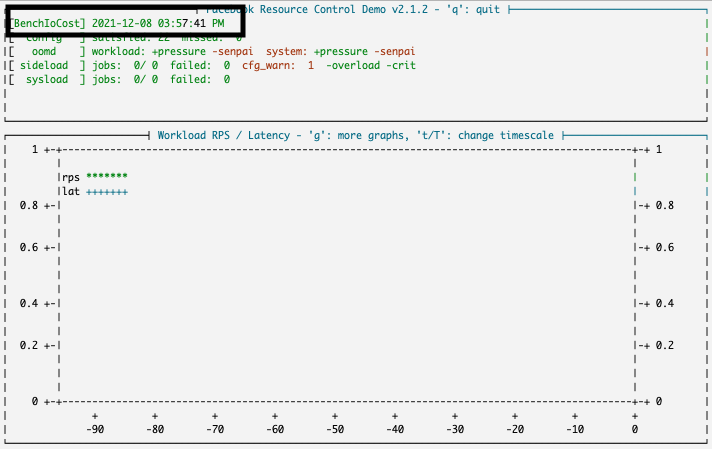
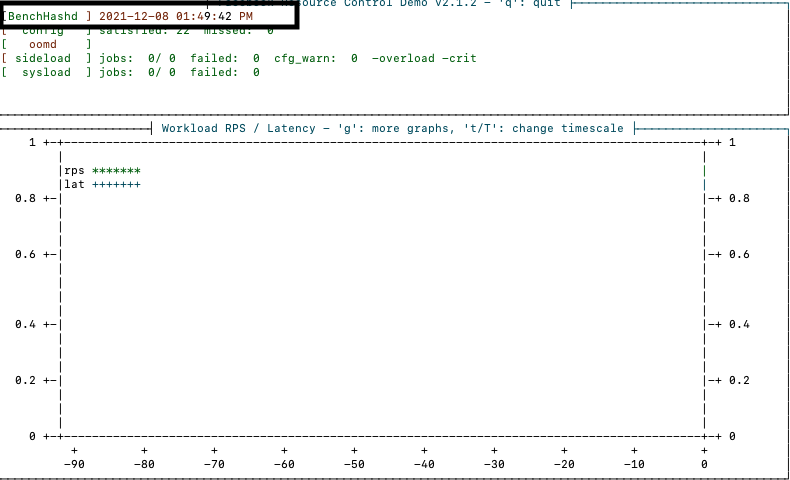
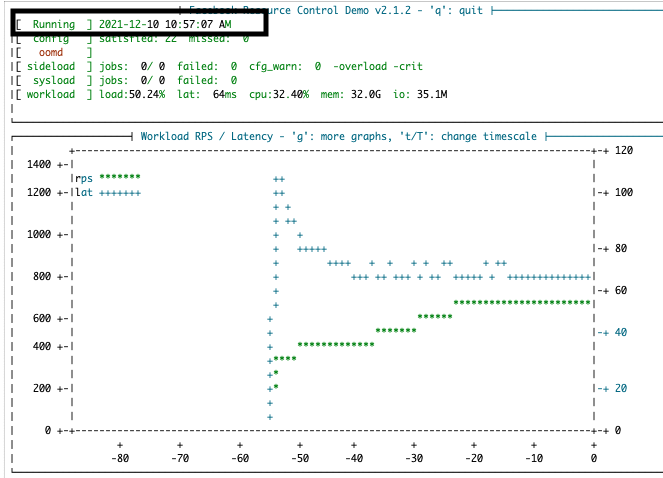
heartbeat timestamp. The state will first show BenchIoCost followed by
BenchHashd, and finally Running when both benchmarks are complete.
The "Other logs" pane on the left shows what's going on. Check out the fullscreen log view with the 'l' key if the view is too cramped. You can also
access the logs directly with journalctl -u UNIT_NAME.
For the benchmarks, the unit names are rd-iocost-bench.service and rd-hashd-bench.service.
Read On
You can learn more about the iocost controller and hashd simulator, rerun the benchmarks, and tune and verify their results on the following pages.
Otherwise, sit back, wait for the benchmarks to finish and the status change to "Running", and then continue to the Running the Demo tutorial.