Memory Controller
Memory utilization is a key area where resource control can make big efficiency improvements. In this section we’ll look in detail at the cgroup2 memory controller, and how to get started configuring its interface files for controlling system memory resources.
Core interface files
Like all cgroup controllers, the memory controller creates a set of interface files in its child cgroups whenever it’s enabled. You adjust the distribution of memory resources by modifying these interface files, often within a Chef recipe or container job description.
Here are some of the memory controller's core interface files. Amounts in these files are expressed in bytes.
Note: Be sure to see the canonical cgroup2 reference documentation for additional details.
| File | Description |
|---|---|
memory.current | Shows the total amount of memory currently being used by the cgroup and its descendants. It includes page cache, in-kernel data structures such as inodes, and network buffers. |
memory.highmemory.max | memory.high is the memory usage throttle limit. This is the main mechanism to control a cgroup’s memory use. If a cgroup's memory use goes over the high boundary specified here, the cgroup’s processes are throttled and put under heavy reclaim pressure. The default is max, meaning there is no limit.memory.max is the memory usage hard limit, acting as the final protection mechanism: If a cgroup's memory usage reaches this limit and can't be reduced, the system OOM killer is invoked on the cgroup. Under certain circumstances, usage may go over the memory.high limit temporarily. When the high limit is used and monitored properly, memory.max serves mainly to provide the final safety net. The default is max. |
memory.lowmemory.min | memory.low is the best-effort memory protection, a “soft guarantee” that if the cgroup and all its descendants are below this threshold, the cgroup's memory won't be reclaimed unless memory can’t be reclaimed from any unprotected cgroups. memory.min specifies a minimum amount of memory the cgroup must always retain, i.e., memory that can never be reclaimed by the system. If the cgroup’s memory usage reaches this low limit and can’t be increased, the system OOM killer will be invoked. |
memory.swap.currentmemory.swap.max | memory.swap.current is the total amount of swap currently used by the cgroup and its descendants. memory.swap.max is the swap usage hard limit. If a cgroup's swap usage reaches this limit, anonymous memory of the cgroup will not be swapped out; memory that already has swap slots allocated to it can continue to be swapped out. The default is max. |
The fbtax2 memory controller configuration
Memory contention between system binaries and the main workload was one of the most common causes of resource problems. The fbtax2 project team experimented with a few different memory controller configurations before resolving the issue.
memory.high
Because a primary goal of the fbtax2 cgroup hierarchy was restricting memory used by the system binaries in system.slice, the team first tried setting a memory limit for system.slice in its memory.high config file.
The problem was that restricting memory on these system binaries made them more prone to thrashing and OOMs. Since some of these system.slice processes are critical to the main workload, if they fail, the main workload stops running.
memory.low
To work around this problem, the team instead used memory.low to soft-guarantee memory to workload.sliceand to a lesser extent workload-support.slice where system binaries required by the workload are grouped.
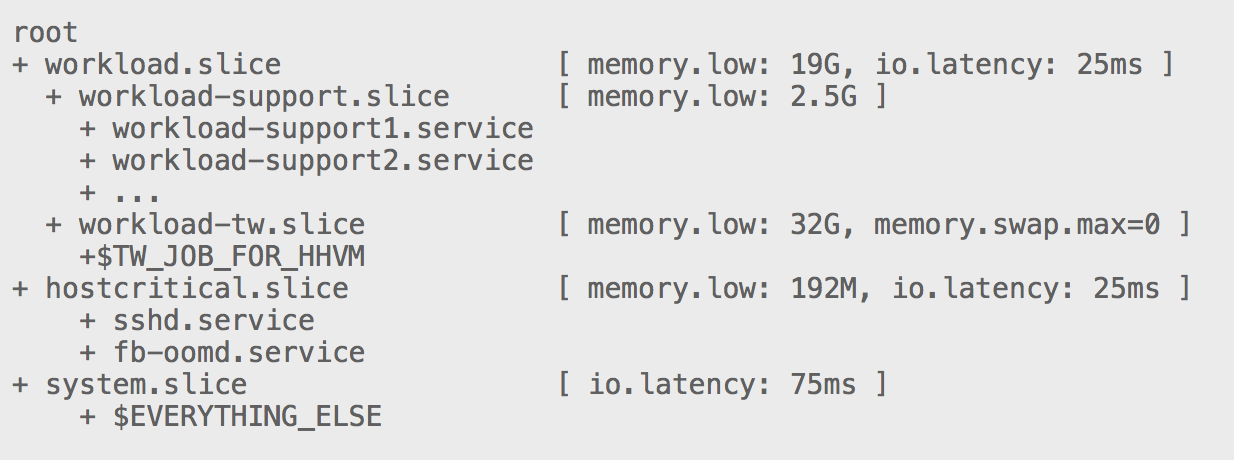
On this host, the total memory available was around 32G. The team committed 19G to workload.slice and 192M (0.2G) to hostcritical.slice. In addition, hhvm uses 6.95G for hugepages, which is locked hard consumption.
This adds up to approximately 26G, leaving just under 6G up for grabs. These memory.low protections leave sufficient memory to prevent system.slice failures, and reduce the likelihood of OOM kills by providing the kernel plenty of leeway when the whole system is under stress.
In addition, any memory that's guaranteed but unused can be allocated to other processes, further optimizing memory utilization.
Determining working set size
To find optimal settings for memory.low, the team first had to determine a working set size for memory. To get a baseline picture of the system's memory use, they queried memory.current:
cat /sys/fs/cgroup/memory.current
To get an accurate result, it's necessary to read memory.current when the system is under some memory pressure, due to the way the kernel hoards resources when it's idle. The fbtax2 team applied moderate memory pressure, then read memory.current, repeating the process on a number of machines and averaging the result. This provided the baseline for memory.low, which they optimized through further experimentation.
The 192MB in memory.low for hostcritical.slice is low, but sufficient to keep the processes there running. Note that the team set this amount for hostcritical.slice in both memory.low and memory.min since some kernels still lack memory.min, but ultimately the hard guarantee offered by memory.min is required to protect hostcritical.slice.
Using swap
Swap historically has a bad reputation, especially on roational disks; enabling swap unchecked can lead to thrashing and system lockups. The team discovered however that using swap in conjunction with other tools in this setup provided a number of benefits:
- A more gradual failure mode when memory becomes scarce, an alternative to hitting hard memory limits that often result in thrashing and OOM kills.
- More headroom for critical tools like oomd to run, due to the less abrupt and more graceful handling of memory shortages.
- General system efficiency improvements.
Because swap is slow on the hard disk drives used on many of the hosts in this tier, the team disabled swap for the main workload in the workload-tw.slice cgroup, setting memory.swap.max to 0, as shown above. This allowed less latency-sensitive processes in system.slice to benefit from swap, while avoiding the slowdowns swap would cause for the main workload.
oomd is the key that makes the use of swap possible in this case. In the next section of this case study, we'll take a closer look at oomd, how it uses PSI metrics to resolve OOM situations more gracefully, and how it enables the use of swap.
Monitoring and utility interface files
In addition to memory.current, the interface files below help you monitor memory use, see the results of changes, and take specific actions based on their settings.
| File | Description |
|---|---|
memory.pressure | A file containing memory pressure, a Pressure Stall Information (PSI) metric showing general memory health, as a measurement of the CPU time lost due to lack of memory. Provides a measurement of memory pressure that can be monitored by applications, which can use pressure thresholds to trigger various actions, e.g., load shedding or killing processes when pressure spikes. See the PSI pressure metrics page for additional details. |
memory.events | A file that shows the number of times certain memory events have occurred in the cgroup. Generates file-modified events that allow applications to track and monitor changes:low—The number of times the cgroup is reclaimed due to high memory pressure even though its usage is under the low boundary. This usually indicates that the low boundary is over-committed.high—The number of times processes of the cgroup are throttled and routed to perform direct memory reclaim because the high memory boundary was exceeded.max—The number of times the cgroup's memory usage was about to go over the max boundary.oom—The number of times the cgroup's memory usage reached the limit and allocation was about to fail. Depending on context, the result could be invoking the OOM killer and retrying allocation, or failing allocation.oom_kill—The number of processes in this cgroup or its subtree killed by any kind of OOM killer. This could be because of a breach of the cgroup’s memory limit, one of its ancestors’ memory limits, or an overall system memory shortage. |
memory.stat | A file that breaks down the cgroup's memory footprint into different types of memory (e.g., kernel stack, slab, sock, etc.) and provides additional info on the state and past events of the memory management system. Includes memory consumption of the cgroup’s entire subtree. |
memory.oom_group | Allows all processes of an entire cgroup to be handled as a single memory consumer, enabling the kernel OOM killer to compare the total memory consumption of the cgroup with other memory consumers (including other cgroups with memory.oom_group set) and kill an entire cgroup if necessary. |