PSI Pressure Metrics
Pressure Stall Information (PSI) metrics provide for the first time a canonical way to see resource pressure increases as they develop, with new pressure metrics for three major resources—memory, CPU, and IO.
These pressure metrics, in conjunction with cgroup2 and other kernel and userspace tools described in this guide, provide the information you need to detect resource shortages while they’re developing, and respond intelligently—by pausing or killing non-essentials, reallocating memory in the system, or by load shedding.
In short, these stats are like barometers that provide fair warning of impending resource shortages, enabling you to take more proactive, granular, and nuanced steps when resources start becoming scarce.
cgroup2 interface
In a system with the cgroup2 filesystem
mounted, pressure stall information is tracked for tasks grouped
into cgroups. The subdirectory for each cgroup controller in the cgroupfs mountpoint contains
cpu.pressure, memory.pressure, and io.pressure files.
You query PSI for a cgroup by running the following command. This example queries cpu.pressure for a cgroup called cg1:
$ cat /sys/fs/cgroup/cg1/cpu.pressure
The output format for CPU is:
some avg10=0.00 avg60=0.00 avg300=0.00 total=0
and for memory and IO:
some avg10=0.00 avg60=0.00 avg300=0.00 total=0
full avg10=0.00 avg60=0.00 avg300=0.00 total=0
Memory and IO show two metrics: some and full. The CPU controller shows only the some metric. The values for both some and full are shown in running averages over the last 10 seconds, 1 minute, and 5 minutes, respectively. The total statistic is the accumulated microseconds.
PSI shows pressure as a percentage of walltime in which some or all processes are blocked on a resource:
someis the percentage of walltime that some (one or more) tasks were delayed due to lack of resources—for example, a lack of memory.fullis the percentage of walltime in which all tasks were delayed by lack of resources, i.e., the amount of completely unproductive time.
See the PSI docs for more details on these metrics.
Memory pressure in the fbtax2 project
With the PSI memory pressure metrics, the fbtax2 team finally had a tool to determine if a given workload has enough memory, and to provide general insight into system memory use, that was better than the trial and error processes they had to rely on before.
As discussed previously, a key goal in designing the fbtax2 cgroup hierarchy was protecting workload.slice from resource collisions with widely-distributed system binaries in system.slice.
Processes in system.slice tend to be less latency-sensitive than workload.slice processes, and can usually ride out slowdowns caused by lack of memory without serious consequences. As a result, workload.slice is given resource priority at the expense of slowdowns in system.slice, helping ensure the stability of the main workload.
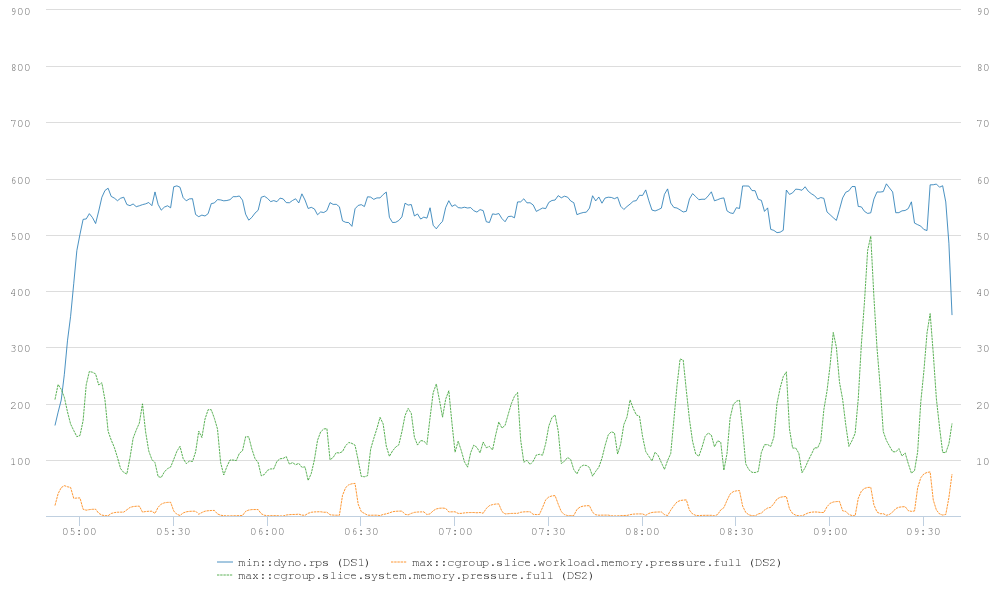
This chart shows how the PSI memory pressure metrics allowed the team to see clearly the results of their efforts: memory.pressure.full for system.slice (green line) spiked as high as 50% (right X-axis), while pressure for workload.slice (orange line) stayed under 10%, indicating its increased memory priority and protection. Meanwhile, system performance as a whole (blue line) remained relatively stable between 500 and 600 rps (left X-axis).

We'll look at the specific memory controller configurations fbtax2 used to get these results in the next section of this case study.
